SynthPulse External monitoring · Fleet-side agent

SynthPulse — monitoring for the products we didn’t build.

SynthGateway watches your Synthology and XyDromatics fleet from the inside — every product reports its own health. SynthPulse extends that same monitoring to the third-party and other-vendor systems running alongside it: a foreign PACS, an HL7 interface, a database, a DICOM listener. It probes them from the outside and reports to the same gateway, so the whole environment lands in one view.

Push when you can, probe when you can’t. A product that can report its own health talks straight to the gateway; one that can’t gets watched by SynthPulse — reachability, TLS expiry, and a real DICOM C-ECHO — PHI-free. Since 1.1 you see all of it on SynthPulse’s own admin console too: what is monitored, what is down, and the history.

At a glance

Classification
Business software · not a medical device
Data posture
PHI-free — numeric liveness metrics only
Deployment
Customer-operated · admin console + service
Platforms
Windows service · Linux systemd
Licence
One site licence · RBAC controls use
Full regulatory posture →

The problem it solves

Your fleet reports its health. The rest of the room doesn’t.

Without it

SynthGateway shows every Synthology and XyDromatics product’s health, but a real deployment also has systems you didn’t build — a foreign PACS, another vendor’s interface engine, a database — that report nothing.

You find out one of them is down the way everyone does: a phone call. And a port-open check wouldn’t have helped — a DICOM peer can accept a TCP connection and still refuse every association.

With SynthPulse

SynthPulse probes those third-party systems from the outside — reachability, TLS certificate expiry, and a real DICOM C-ECHO that proves the peer answers — and reports to the same gateway your fleet already uses.

Its own console shows you what is monitored, what is DOWN right now and the last week’s history; the gateway shows your support team the same thing alongside the fleet. “Is the whole room up?” becomes a glance, not a round of phone calls.

What it does

Probe from the outside, report to the gateway.

Black-box liveness probes

Prove a target is actually up — not just that a port answered.

  • Reachability, HTTP status code, and TLS certificate expiry, on a schedule
  • Raw transport connect on any port — an HL7/MLLP interface, a database, a DICOM listener
  • A real DICOM C-ECHO: proves the peer accepts a DICOM association and answers Success — something a bare port-open check can never tell you
  • Every result is a numeric metric, timestamped and charset-validated
An admin console — and the gateway

See it locally; your support team sees the same picture.

  • Dashboard, Targets, Results and Gateway pages on the host — what is monitored, what is DOWN right now, and why
  • Add, edit, test and remove targets in the browser; changes apply within seconds, no restart
  • Seven days of local history per target — availability, p95 latency, up/down transitions, whether each result reached the gateway
  • Every target also appears as an external agent on SynthGateway and in SynthInSight, alongside the fleet

Targets from two places, one list

Your list on the host, plus the list your support team keeps on the gateway.

  • Local targets live in a plain file the console edits for you (or the CLI, or an editor)
  • Gateway-managed targets are added by Synthology support on a call — no access to your host, no restart
  • A local row with the same agent, kind and endpoint always wins — your override is authoritative
  • The last good gateway list is cached, so a restart during a gateway outage keeps monitoring

Deploys like every Synthology product

A Windows service or a Linux systemd daemon, licensed with one site licence.

  • One site licence grants every capability; roles (RBAC), local, LDAP / AD or SynthConstellation sign-in decide who may do what
  • Console on one port (5134 by default); a headless mode runs the probes with no listening socket at all
  • The gateway credential is a scoped, revocable ingest token — kept in the environment or sealed by the console, never in a shared file
  • Optional support relay: PHI-free health telemetry, consent-gated remote support, off-site configuration backup

PHI-free by design

It measures liveness, never content.

  • Numeric metrics only, with charset-validated names — never message bodies or images
  • A C-ECHO verifies the association handshake; it never queries or moves a study
  • Nothing a probe collects is patient data
  • General-purpose business software — not a medical device, no clinical function

See it

The whole room, on one screen.

Live captures from a running installation — click any screen to enlarge it.

01

Dashboard

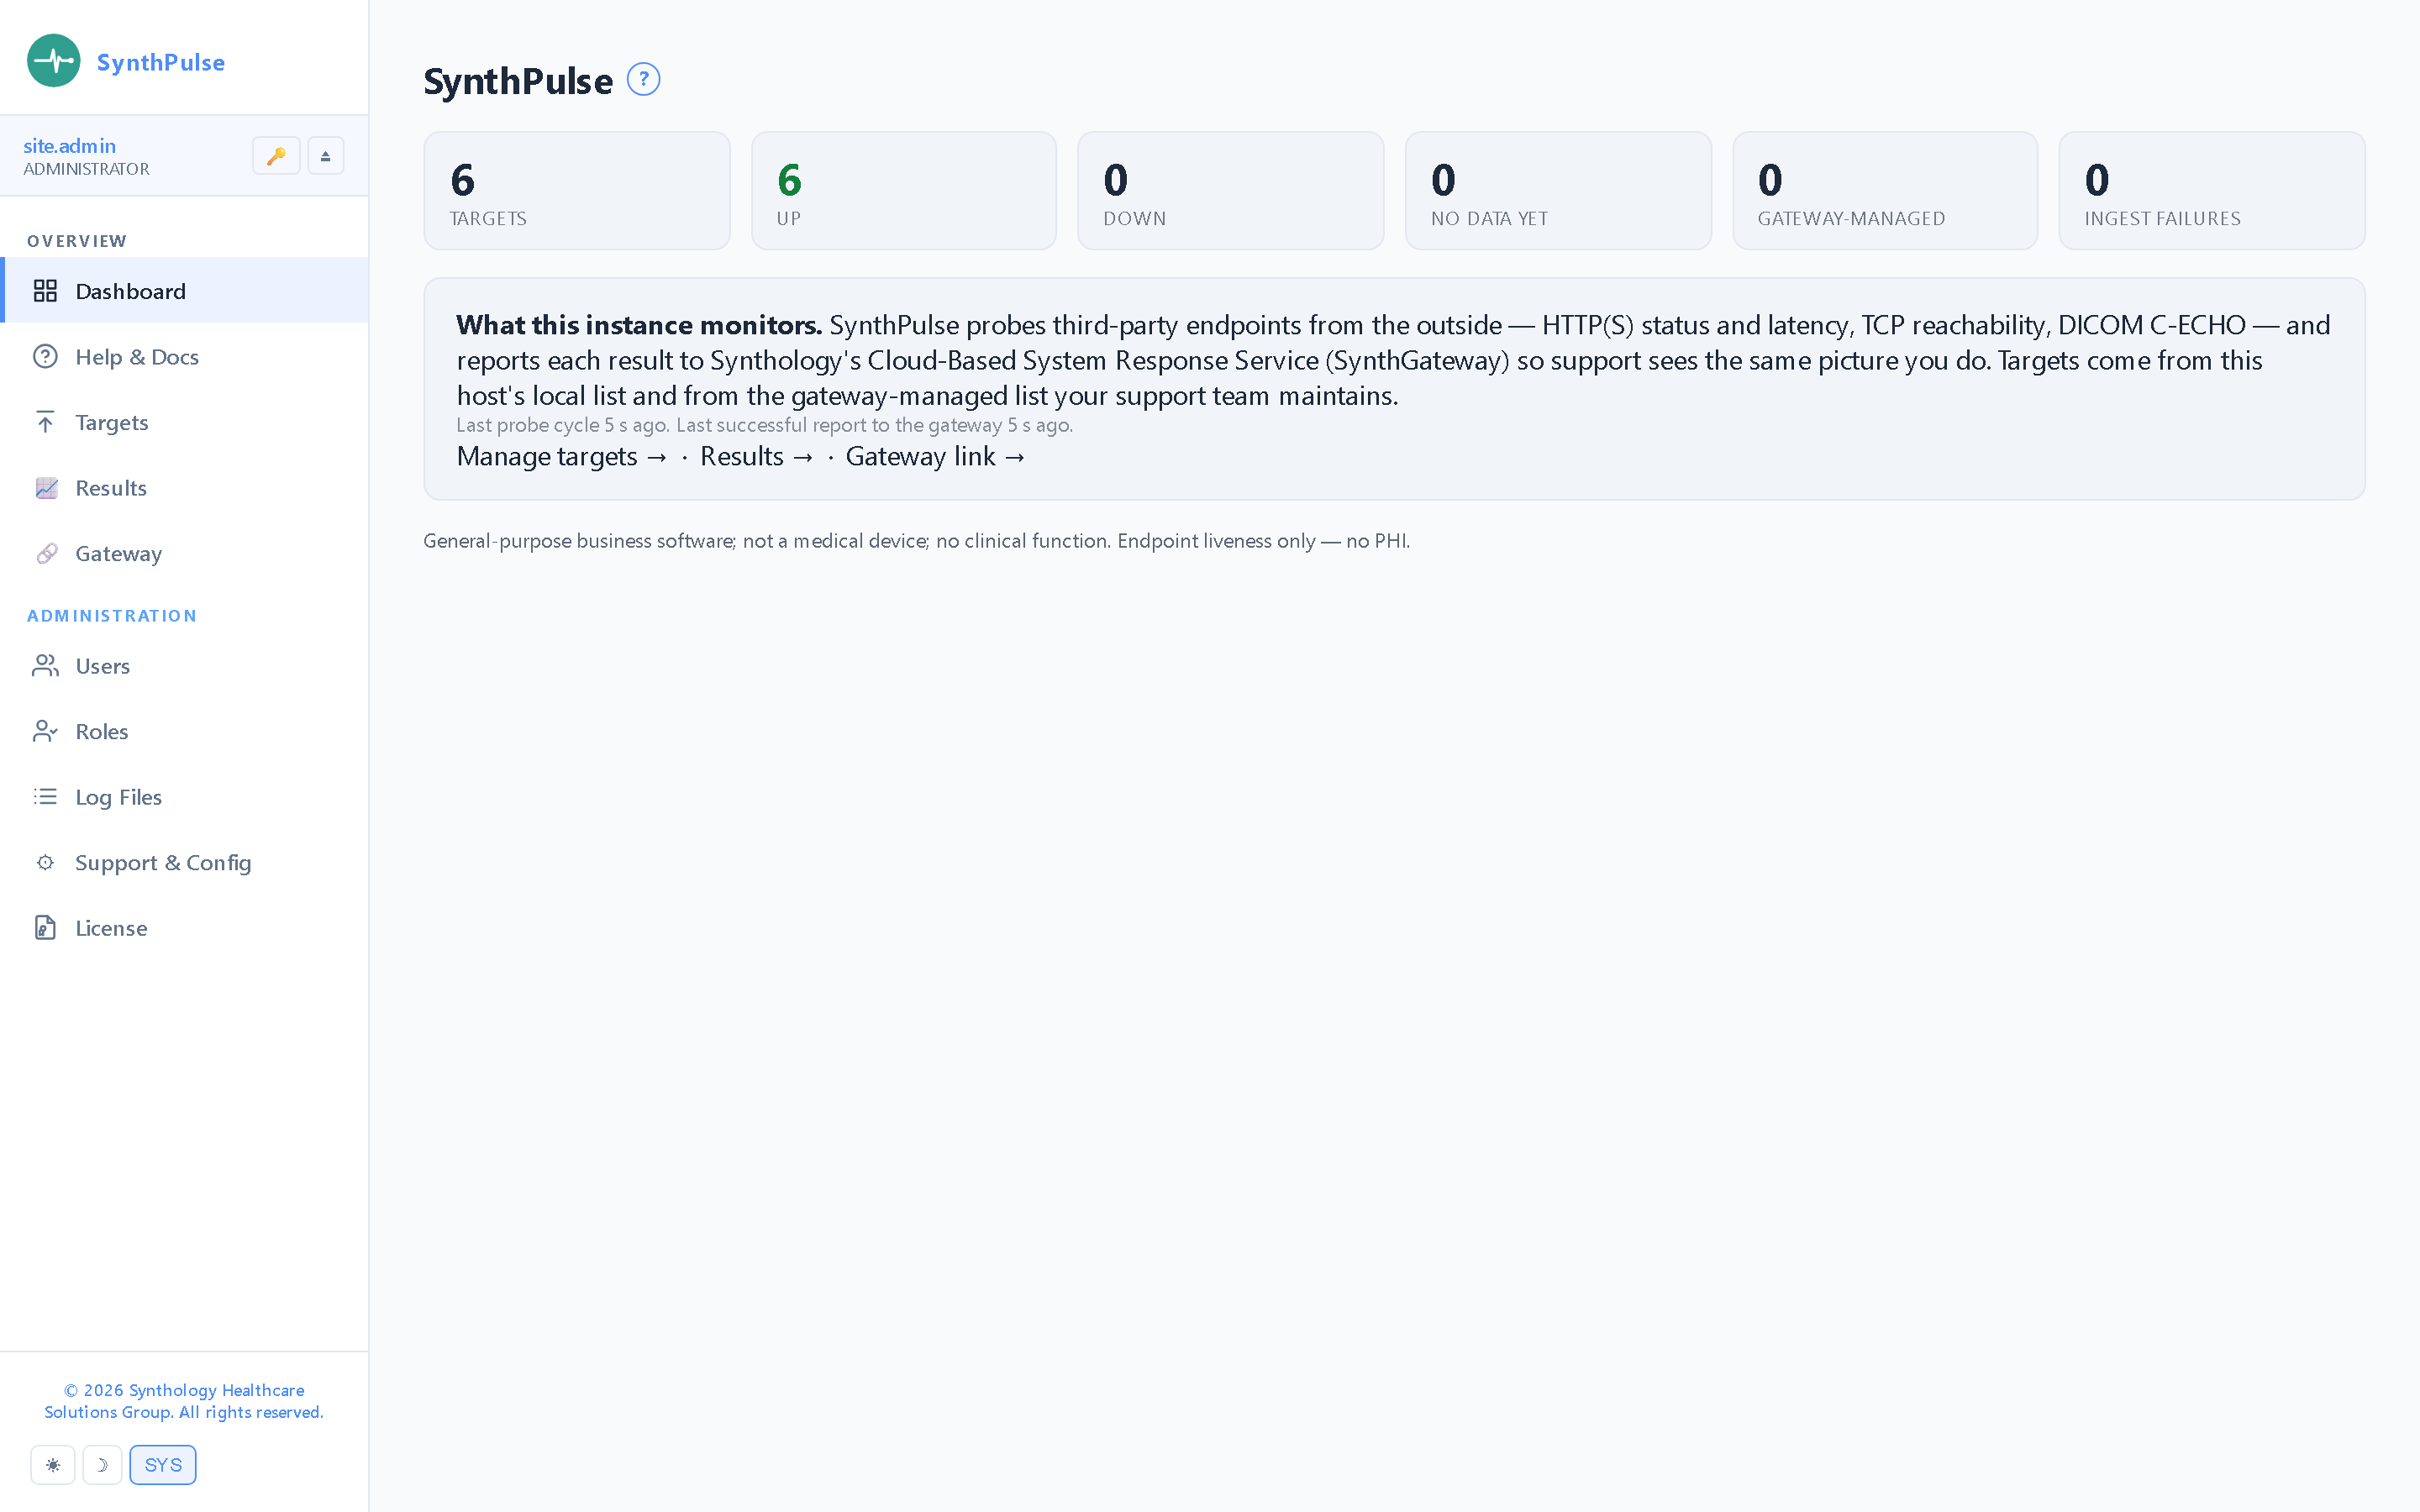
Targets, up, down, no-data-yet, gateway-managed and ingest failures at a glance — plus the last probe cycle, the last successful report to the gateway, and anything that is DOWN right now with its error and since-when.

02

Results

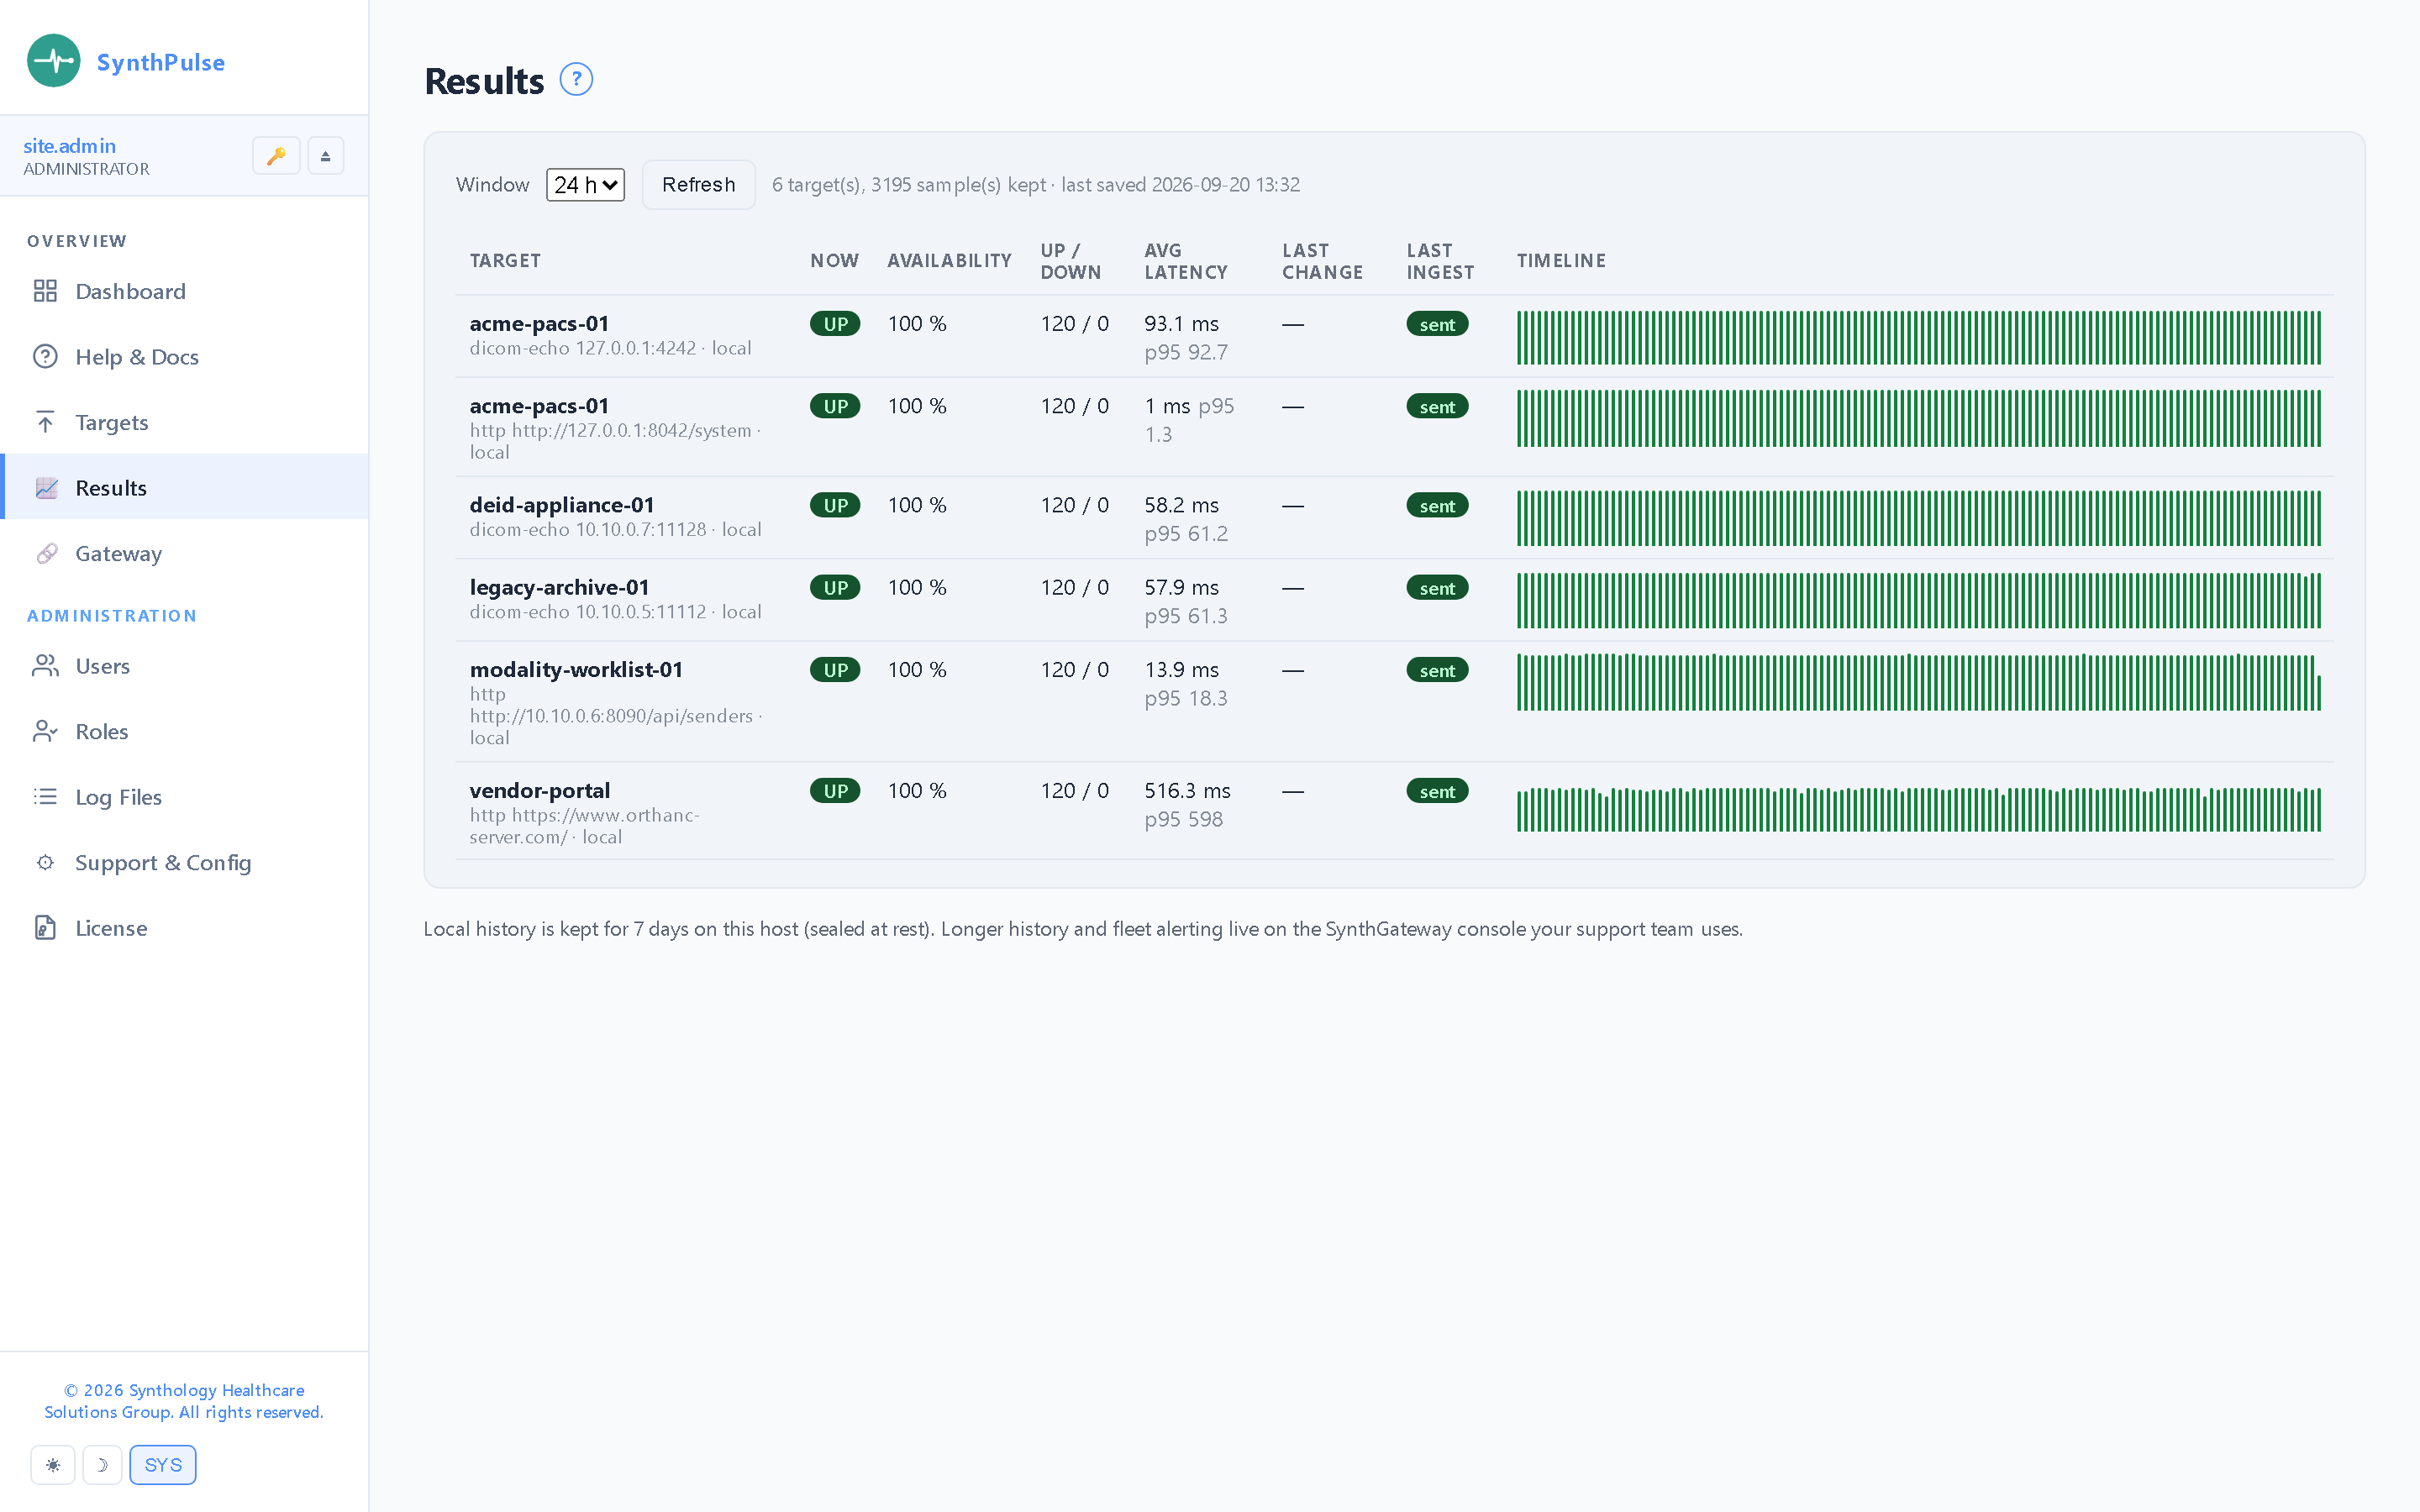
Seven days of local history per target: availability, up/down counts, average and p95 latency, the last state change, whether the result reached the gateway — and a timeline that shows exactly when an outage started and ended.

03

Gateway link

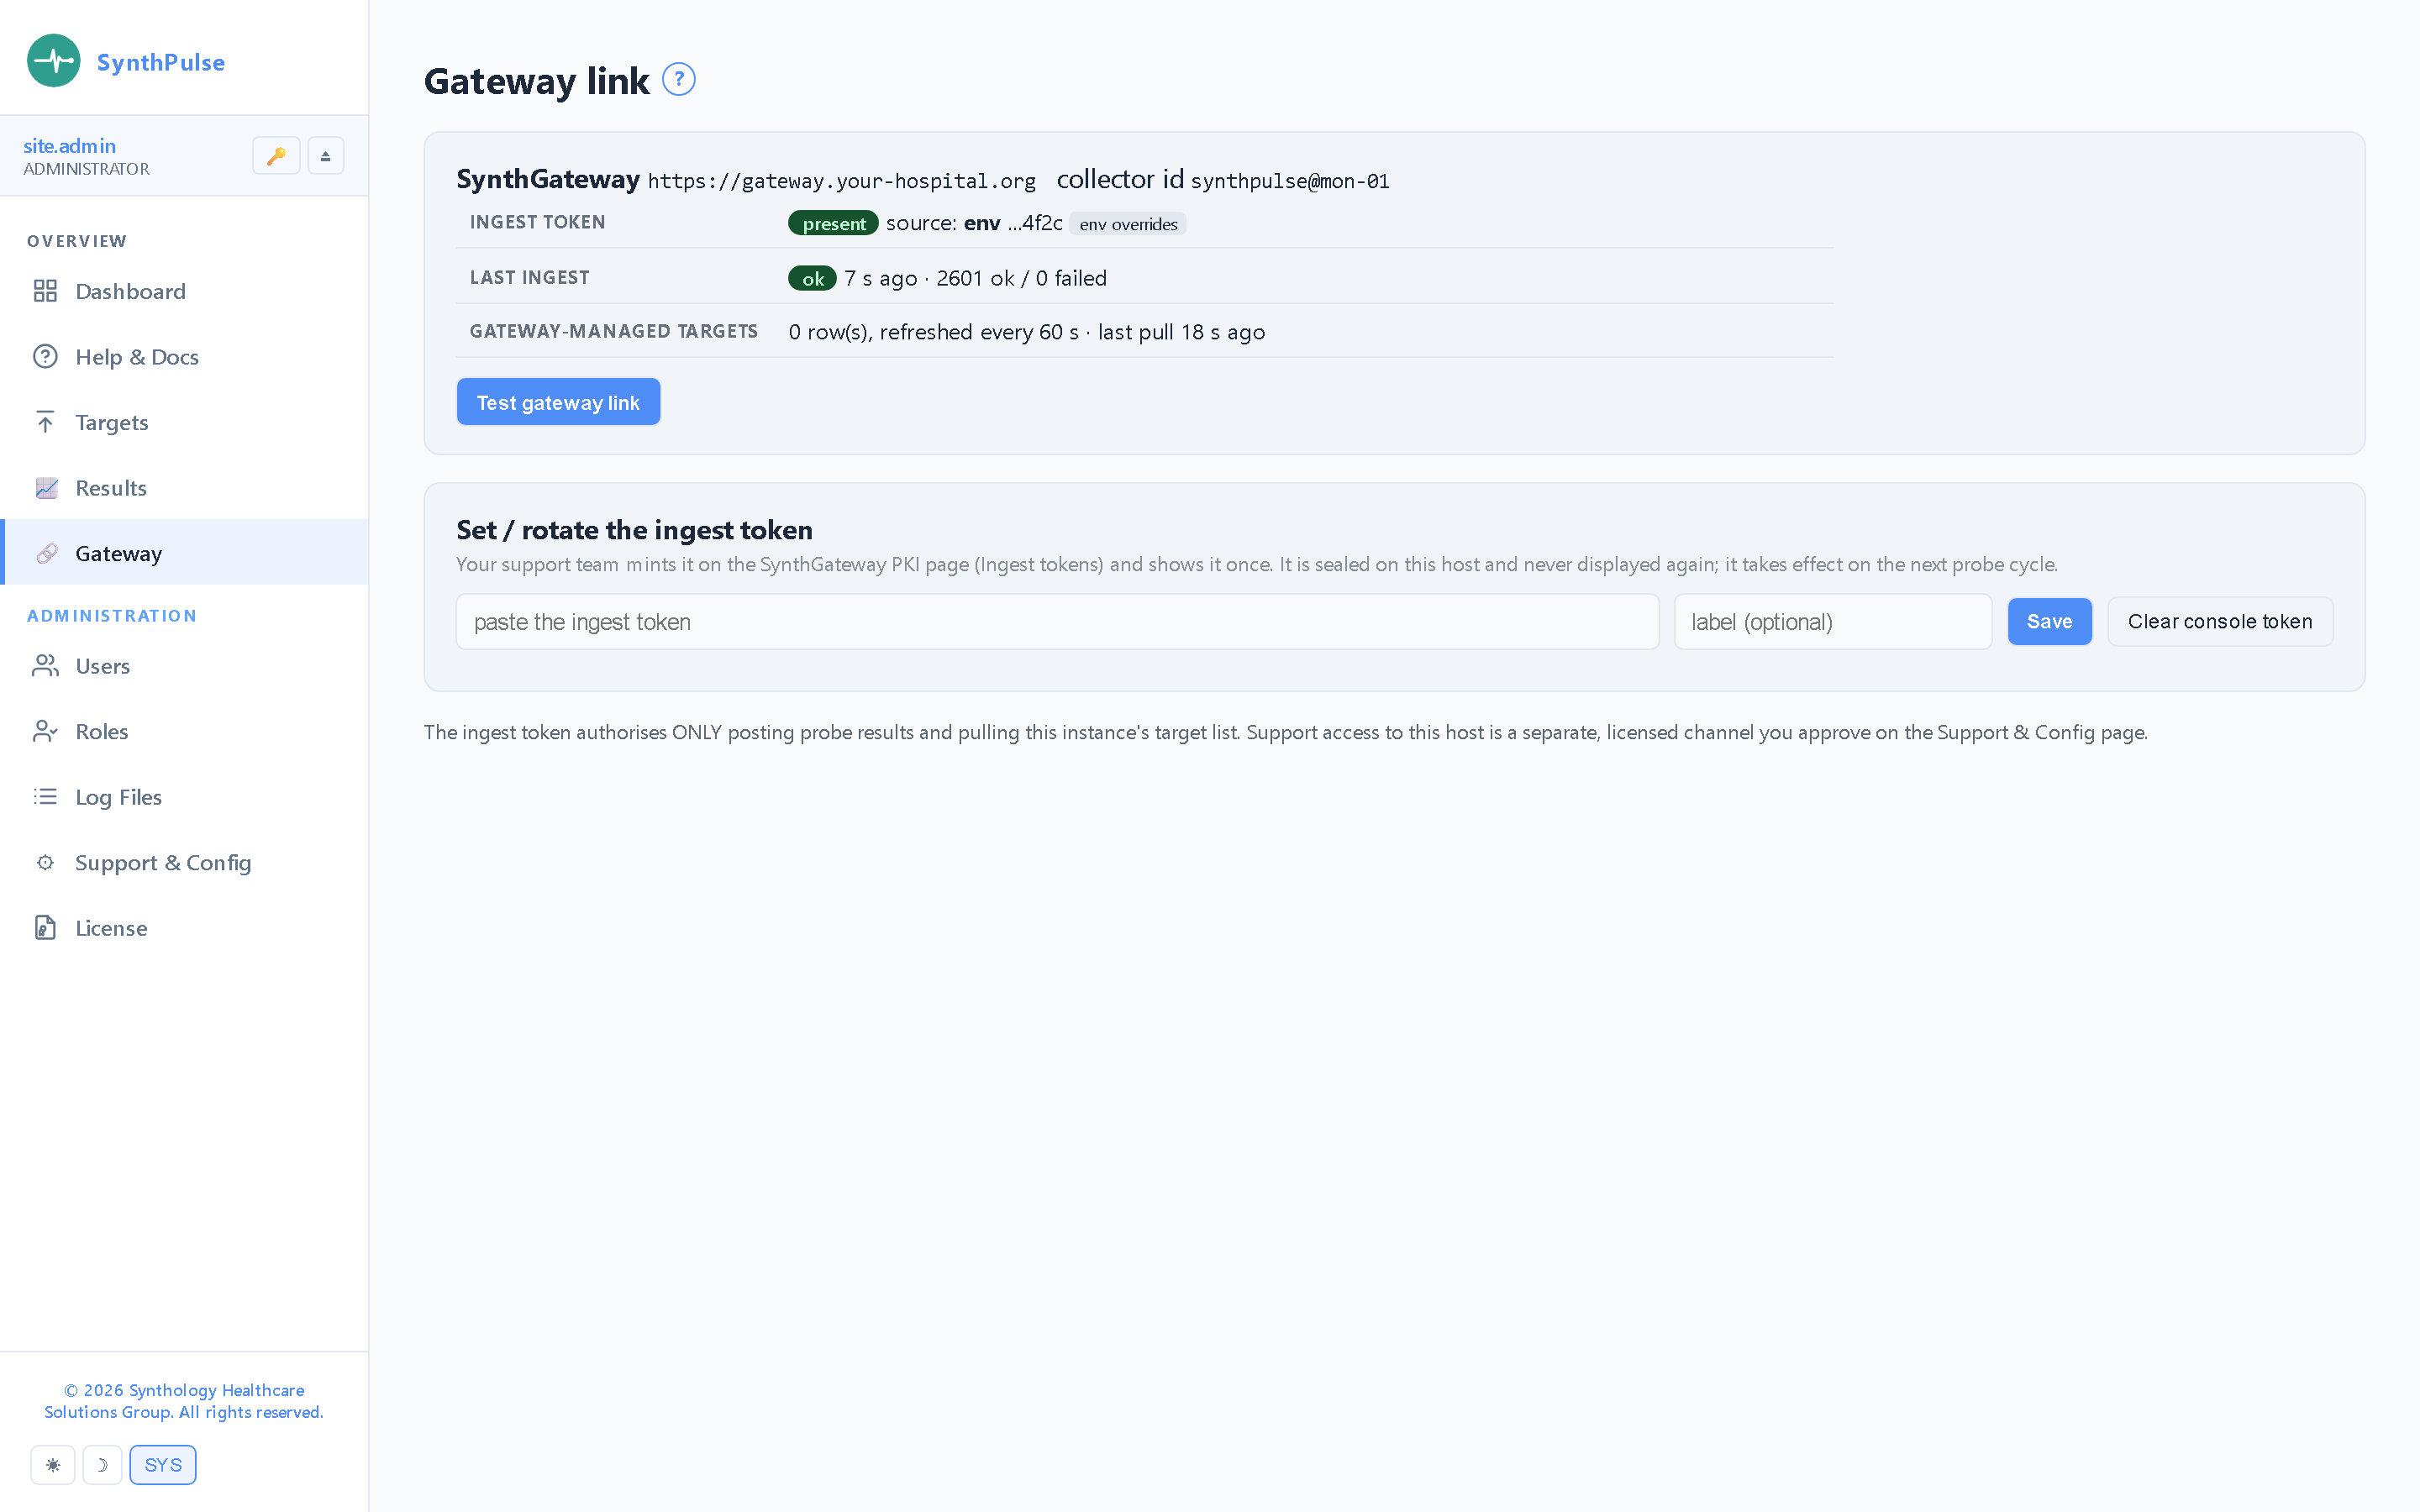
Which SynthGateway this instance reports to, where its ingest token comes from (never the value), the last report and counters, and the gateway-managed target pull — with a one-click round-trip test.

How a probe works

Point, probe, report.

Step 1

Point it at a target

Install SynthPulse on any host that can reach what you want to watch, open the console, and add a target — a host and port, an HTTPS endpoint, or a DICOM AE for a C-ECHO. Press Test now before you save. Your support team can add targets from the gateway too.

Step 2

Probe on a schedule

Reachability, HTTP status, TLS expiry, raw transport connect, or a real DICOM association — from your side of the network, with nothing to install on the monitored system.

Step 3

See it, and report it

The Dashboard and Results pages show state and history locally; numeric metrics go to SynthGateway over a scoped ingest token, where the target appears as an external agent alongside the fleet — no PHI, ever.

Push when you can, probe when you can’t. A product that can report its own health talks straight to the SynthGateway ingest API; one that can’t gets watched by SynthPulse from the outside. Both land in the same monitoring, alongside the Synthology fleet. Selection guidance: DOC-2026-485 (Ingest API vs SynthPulse).

Availability & posture

Customer-operated business software.

SynthPulse is a product you deploy and operate — a Windows service or a Linux systemd daemon with its own admin console, licensed with one site licence like every Synthology product. It is general-purpose business software; not a medical device; no clinical function: it measures liveness and reports numeric metrics. It never transfers, stores, converts or displays a medical image or any medical device data, and it is PHI-free by design.

Documentation

The controlled-document set.

Every SynthPulse deployment ships with the documents below, all managed under SynthQMS document control. SynthPulse is a monitoring agent, not a DICOM data product, so it carries no DICOM Conformance Statement; the documents are shared under mutual NDA.

Document Title Notes
DOC-2026-482 Hardware & Software Requirements (SynthPulse) Sizing, OS support, dependencies
Pending EULA Annex (SynthPulse) Annex to the Synthology Master EULA (DOC-2026-063)
Pending Penetration Test Results (SynthPulse) Available under NDA
Pending QA Runner Manual (SynthPulse) Internal QA + customer-validated test runs
DOC-2026-484 End User Guide (SynthPulse) Probe configuration, scheduling, gateway ingest token
DOC-2026-483 Installation Guide (SynthPulse) Windows service, Linux systemd, or cron; outbound-only

Watch the whole room, not just your half of it.

If you run Synthology products next to systems from other vendors, SynthPulse brings the whole environment into one monitoring view. Ask us for a walkthrough.